MS Office
This article shows how to access the REST API of ADOxx-based products using MS Office's power queries in MS Excel.
Creating the REST request
We want to load a list of all application components and their availability into MS Excel using the search endpoint of our ADOxx-based product's REST API.
We will use the following JSON query to retrieve all application components including their availability attribute.
{
  "filters":
  [
    {"className":"C_EAM_APPLICATION_COMPONENT"}
  ],
  "attributes": ["A_EAM_AVAILABILITY"],
  "scope":
  {
    "repoObjects":true
  }
}
We will encode the string representation of this query (e.g. using JavaScript's encodeURIComponent function, or https://www.onlinewebtoolkit.com/url-encode-decode), which results in
%7B%22filters%22%3A%5B%7B%22className%22%3A%22C_EAM_APPLICATION_COMPONENT%22%7D%5D%2C%22attributes%22%3A%5B%22A_EAM_AVAILABILITY%22%5D%2C%22scope%22%3A%7B%22repoObjects%22%3Atrue%7D%7D
The URL against which we will now send our GET request is therefore (if our repository has the ID "2b0d81d1-8f9e-415a-94ec-c785ba336adc") <BASE_URL>/rest/4.0/repos/2b0d81d1-8f9e-415a-94ec-c785ba336adc/search?query=%7B%22filters%22%3A%5B%7B%22className%22%3A%22C_EAM_APPLICATION_COMPONENT%22%7D%5D%2C%22attributes%22%3A%5B%22A_EAM_AVAILABILITY%22%5D%2C%22scope%22%3A%7B%22repoObjects%22%3Atrue%7D%7D
Loading data into MS Excel
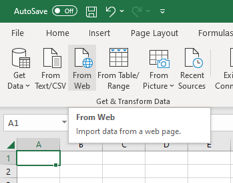
In MS Excel we need to navigate to the Data tab and select From Web.
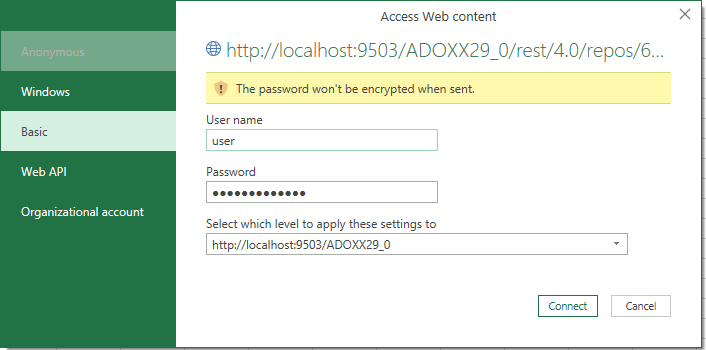
In the opening dialog, we paste the URL we want to send the request to.

Since we need to authenticate, MS Excel will ask us for credentials. Select Basic and provide username and password.
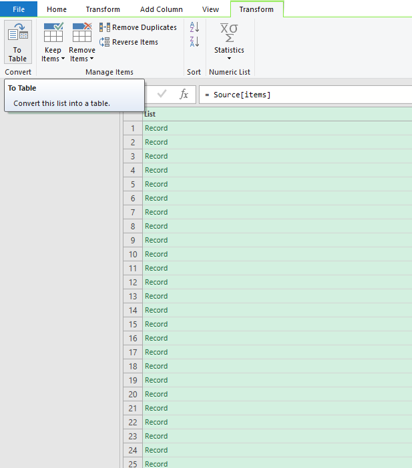
MS Excel will now load the data from the REST API and show a list of the resulting records. Make sure all entries are selected and click on To Table.
In the opening dialog, keep the default values and click OK.

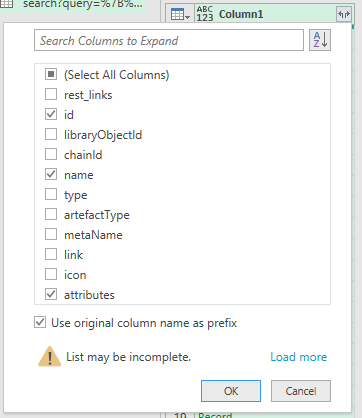
The list is now converted to a table and we can expand each contained record using the icon on the right side of the column header. A dialog will pop up in which we select the fields id, name and attributes.

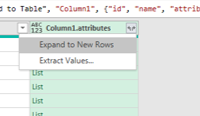
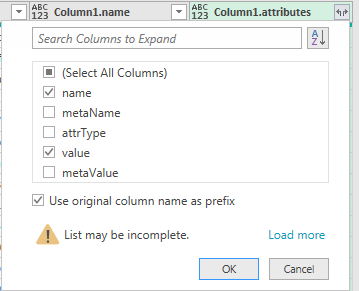
Now for each record, name and id are already shown. Attributes are also shown but as compact list. For the attributes column again click on the icon on the right side of the column header and pick "Expand to New Rows". Select the fields name and value to expand.
Now we have all the data we need on the right layer. On the top left, click on "Close & Load" to get the data into an Excel sheet.

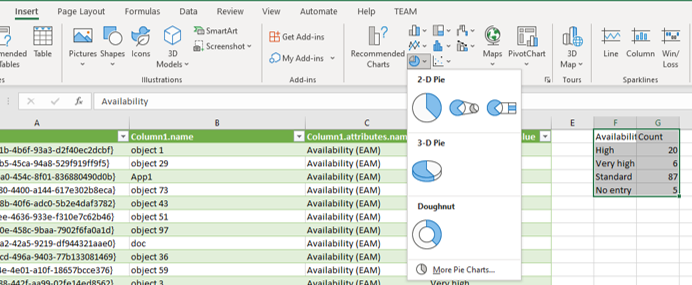
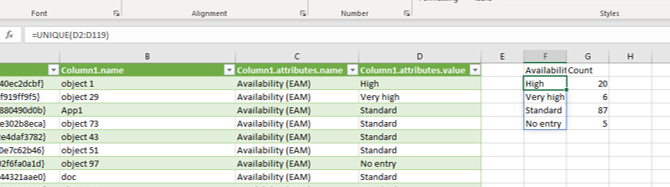
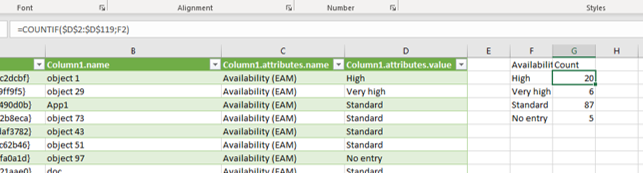
In the sheet, next to the data that is shown, create two new cells "Availability" and "Count".
Beneath "Availability", put the formula =UNIQUE(D2:D?) (where D? should point to the last row in your sheet that contains data, e.g. D102 if you have 100 entries).
Excel will then list all of the unique Availability values beneath the cell "Availability".
In the cell next to the first value, put the formula =COUNTIF($D$2:$D$?;F2) (where $D$? should again point to the last row in your sheet that contains data, e.g. $D$102 if you have 100 entries).
Copy that value to each cell next to one of the unique values.
Finally, select the unique data values and the counts, go to the tab "Insert" and pick a pie chart. This will result in a pie chart showing slices representing the percentage of a certain unique value in the overall set.